Data analysis and dashboards
One trusted view of sales, stock, finance and operations, refreshed automatically.
Usual tools
- Python
- pandas
- SQL
- Matplotlib
- Seaborn
- Streamlit
The problem
Someone spends hours every week copying numbers from different systems into the same spreadsheet, and managers still argue about which figure is right.
What you get
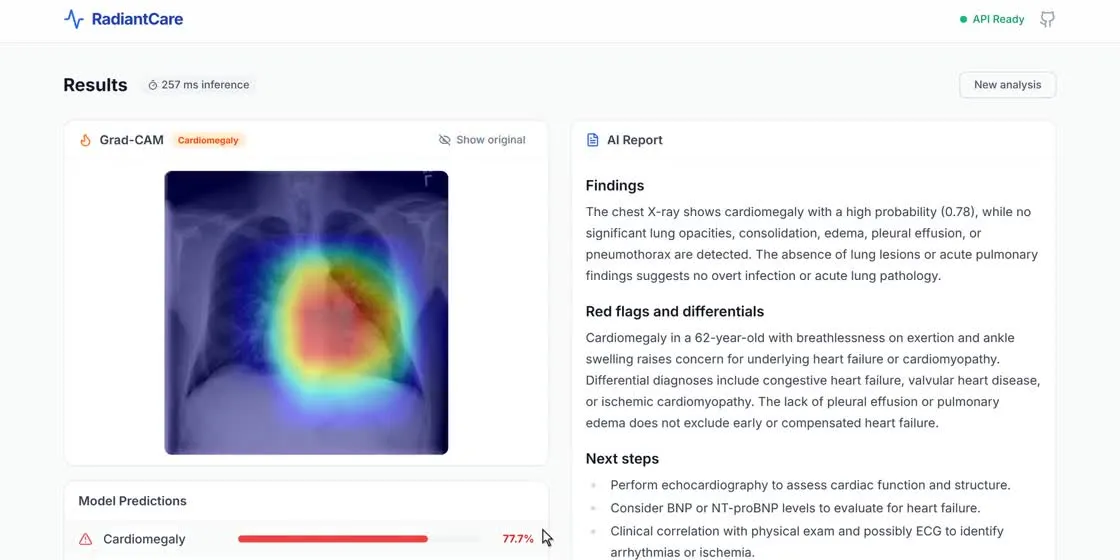
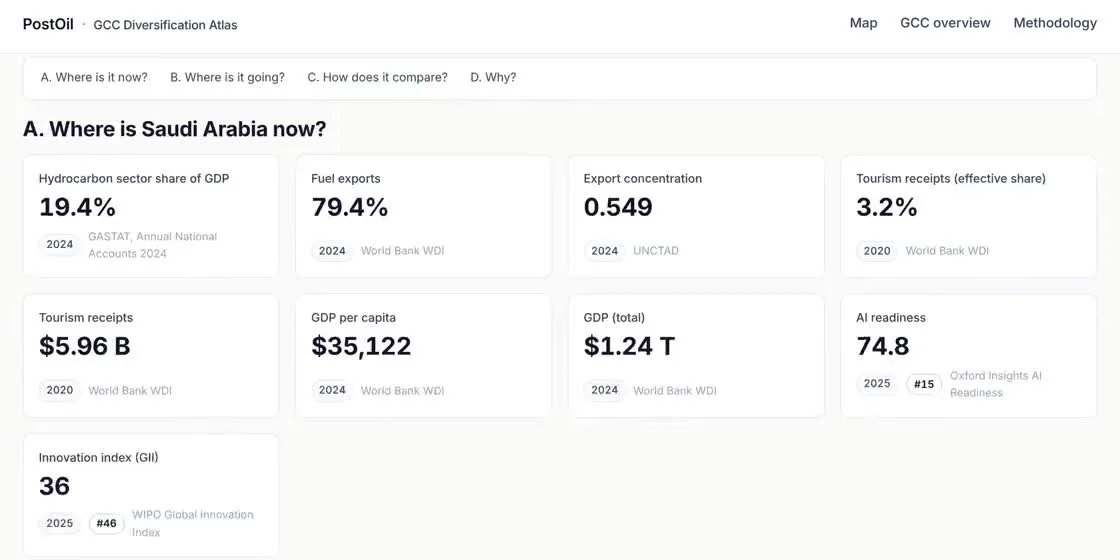
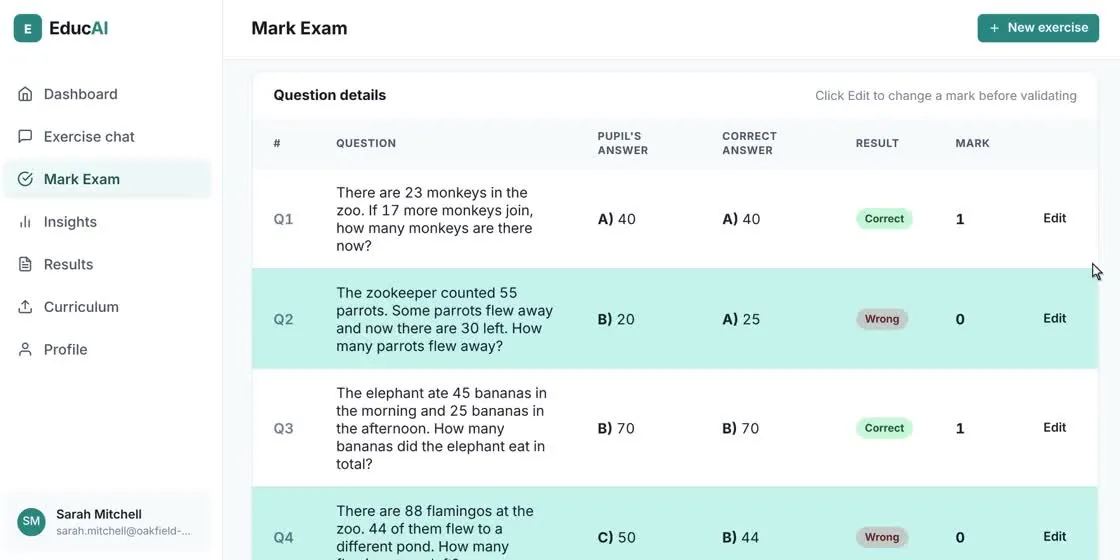
Your data is pulled into one clean, documented dataset, and managers get a dashboard that updates itself and answers the questions they actually ask.
Common uses
- KPI and management dashboards
- Automated weekly and monthly reporting
- One-off analyses that answer a specific business question
- Sales, margin and customer analysis
What can be delivered
- A cleaned, documented dataset
- An interactive dashboard or web report
- Automatic refresh on a schedule
- A short guide for your team